monitoring
ManageEngine OpManager
Network and server monitoring with fault management and reporting.
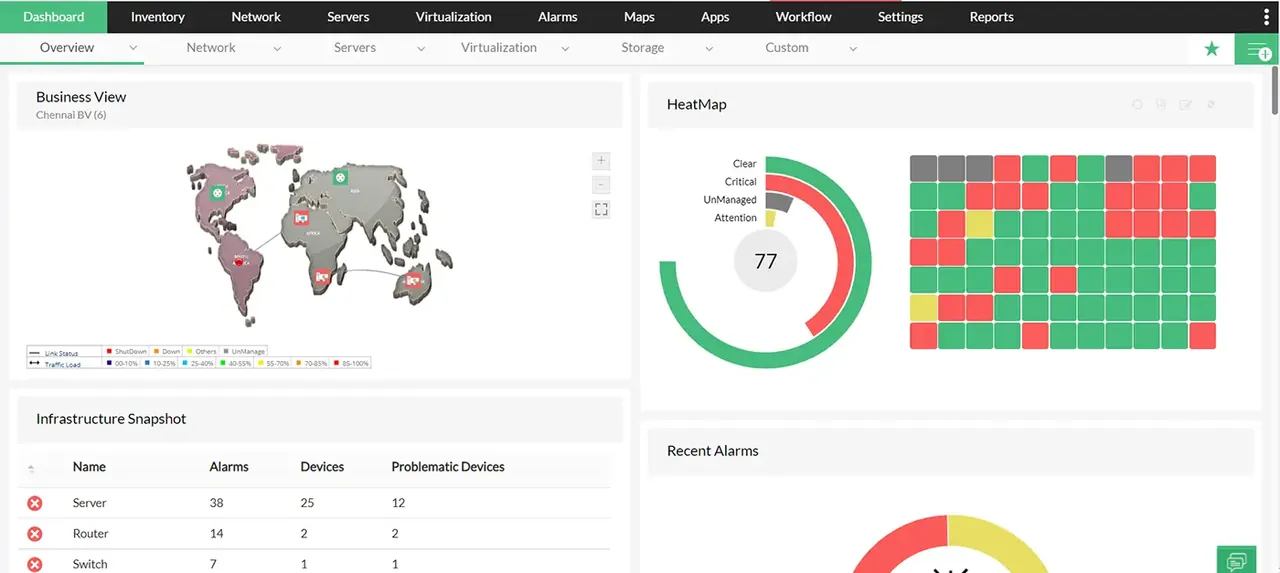
If you look after a growing network and you have reached the point where ad-hoc ping scripts and a spreadsheet of switch IPs no longer cut it, ManageEngine OpManager is one of the tools you will bump into early. It is a self-hosted network and server monitoring product from ManageEngine, the IT-management division of Zoho, and it sits in that practical middle ground: more structured than a free SNMP poller, less sprawling (and less eye-wateringly priced) than the big enterprise suites. This is an independent review — we do not sell it or host it — so here is the honest picture of what it is good at and where it will annoy you.
What ManageEngine OpManager actually does
At its core, OpManager watches your infrastructure and tells you when something breaks or is trending toward breaking. It discovers devices on your network, polls them over SNMP, WMI, CLI and other protocols, and tracks availability and performance for switches, routers, firewalls, servers, and the virtual and physical machines behind them.
Out of that data it builds the things a network admin actually reaches for during an incident: fault and performance dashboards, threshold-based alerting with escalation, automatic network maps and topology views, and a reporting engine for capacity and SLA conversations. It monitors both physical and virtual estates — VMware, Hyper-V and similar — and covers server health (CPU, memory, disk, services) alongside the network layer, so a single console can answer “is it the app, the box, or the link?”
It runs on your own hardware or VM (Windows or Linux), and it is part of the wider ManageEngine family, so it plugs into stablemates like NetFlow Analyzer, OpUtils and the broader ITOM line if you later want traffic analysis or IP address management.
Where it shines
The setup-to-value curve is genuinely good. Discovery is quick, the default templates are sensible, and you get usable maps and dashboards without a week of configuration. For a mid-sized team that wants monitoring working by Friday, that matters.
Breadth is the other strength. Network, server, virtualization and basic application monitoring live in one product rather than three, and the alerting is mature — dependency-aware so you are not paged fifty times when one upstream switch drops. The reporting is presentable enough to hand to management without reformatting, which is more than can be said for a lot of open-source tools.
Being self-hosted is a plus for teams with data-residency rules or air-gapped segments: your monitoring data stays on your infrastructure.
Where it falls short
It is a heavier animal than its friendly first impression suggests. Larger deployments need real resources and tuning, and the web UI, while capable, can feel dense and dated in places — a lot of tabs, a lot of settings. Expect a learning curve past the happy-path setup.
Licensing complexity is the recurring gripe. Capabilities are split across editions and add-ons, so the feature you assumed was included may sit a tier up or in a separate module. Read the edition matrix carefully before you commit.
And while support exists, plenty of admins report that deeper customization and troubleshooting can mean wrestling with documentation and support queues. If you want a lightweight, opinionated tool that does one thing beautifully, this is not it — OpManager is a broad platform, with the trade-offs that implies.
Who it’s for
OpManager fits the internal IT team or NOC of a small-to-large organization that runs a mixed-vendor network and wants one self-hosted console for fault and performance monitoring without stepping up to the cost and weight of the largest enterprise suites. It suits shops that value keeping monitoring data in-house.
It is a weaker fit if you are an MSP wanting cloud-native multi-tenant monitoring (look at SaaS options instead), or a small team that just needs occasional device discovery and would be better served by a free scanner or a lightweight open-source monitor.
Licensing and cost
OpManager is commercial and licensed per device/interface, tiered across editions (broadly a standard, professional and enterprise progression), with optional add-on modules. There is a free evaluation so you can trial it against your own network, and typically a limited free tier for very small device counts. Pricing is quote- and subscription/licence-based and varies by edition, device count and add-ons, so do not trust third-party figures — check current editions and pricing on ManageEngine’s official site, and when you get a build, follow how to verify a download.
How it compares — real alternatives
- PRTG Network Monitor — another self-hosted commercial monitor, licensed by sensor rather than device. Often simpler to reason about for smaller estates; OpManager tends to feel more “suite-like” for mixed network-plus-server monitoring.
- Zabbix — a powerful open-source, self-hosted alternative with no licence fee. More flexible and free, but you trade money for setup effort and in-house expertise.
- SolarWinds NPM — a heavier, pricier enterprise-oriented option if your needs are large and Windows-centric.
Getting it safely — from the vendor’s official site (manageengine.com)
We host nothing here and offer no downloads. OpManager comes only from ManageEngine’s own site at manageengine.com, where you can start the free evaluation, review editions and request pricing. Because ManageEngine installers are widely searched for, they are exactly the kind of software that gets reuploaded to sketchy mirrors — so go direct to the vendor and confirm what you fetched using how to verify a download.
FAQ
Is ManageEngine OpManager free? There is a free evaluation and usually a limited free tier for a small number of devices, but the useful production editions are paid, licensed per device with optional add-ons.
Does it run in the cloud, or do I host it? You host it yourself on Windows or Linux (on-prem or your own VM/cloud instance). It is not a vendor-run SaaS — if you want cloud-hosted monitoring with no server to maintain, look at Auvik instead.
Can it monitor servers and applications, not just network gear? Yes. Alongside network fault and performance monitoring it covers server health, virtualization and basic application/service checks, and integrates with other ManageEngine modules for traffic analysis and more.
About the project
ManageEngine OpManager is developed and maintained by Zoho / ManageEngine. This is an independent catalog — we don't host or distribute the software. For source code, documentation and official releases, see the project's own site.
same segment
Alternatives in Monitoring
All-in-one infrastructure monitoring with sensor-based subscription licensing, self-managed or cloud-hosted.
by PaesslerOpen-source enterprise monitoring for networks, servers, cloud and applications.
by ZabbixLong-standing open-source monitoring engine for hosts, services and network devices.
by Nagios Enterprises