monitoring
Zabbix
Open-source enterprise monitoring for networks, servers, cloud and applications.
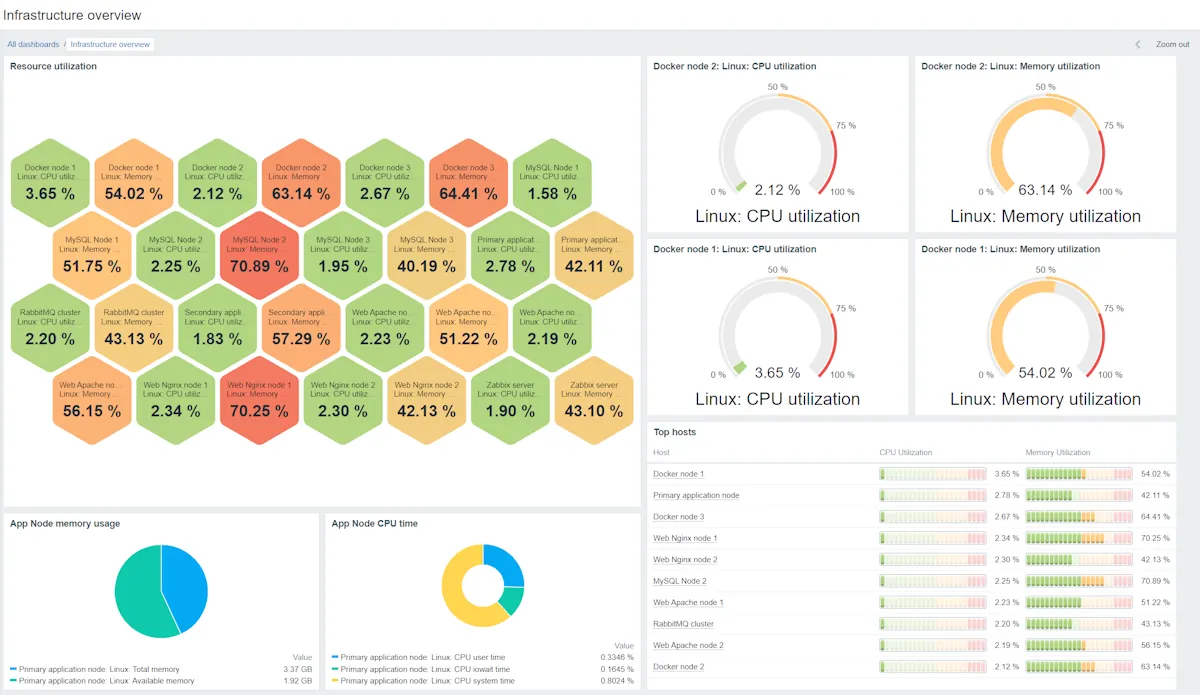
Zabbix is what you reach for when you want serious, enterprise-grade monitoring and you would rather spend engineer time than software budget. Built by Zabbix SIA and given away free under the GPLv2 license, it watches networks, servers, cloud infrastructure, and applications from one self-hosted system — and it does so with a depth that rivals products costing real money per year. The catch, and it is a genuine one, is that all that capability comes with a setup and learning curve that will humble anyone expecting a five-minute install. If you have the patience, few tools give you more control for zero license cost. If you do not, Zabbix will frustrate you.
What Zabbix actually does
At its heart, Zabbix collects metrics, decides when those metrics mean trouble, and tells the right person. It gathers data several ways so it can fit almost any environment: the lightweight Zabbix agent installed on hosts for deep OS-level detail; SNMP for network gear; IPMI for hardware-level server monitoring; JMX for Java applications; and HTTP checks for web services and APIs. Agent or agentless, it copes with both.
Once the data is flowing, Zabbix organizes it with templates — reusable bundles of checks (items) and the trigger conditions that define a problem — so you configure a class of device once and apply it everywhere. Alerting supports escalation paths, routing notifications by severity and by how long a problem has gone unacknowledged. Visualization comes through built-in graphs, dashboards, and topology maps. For large or spread-out estates, Zabbix proxies collect data locally at each site and forward it to the central server, cutting load and keeping monitoring alive even if the link to headquarters drops.
Where it shines
The price is unbeatable: it is free, with no per-node, per-sensor, or per-metric licensing to ration. For a large environment that alone can save a fortune compared with commercial suites.
The depth is the real draw. Templates and triggers are powerful enough to express genuinely sophisticated logic, so once you invest in building them, Zabbix scales cleanly across thousands of hosts. Proxy-based distributed monitoring is a first-class feature, not an afterthought, which makes it excellent for multi-site and geographically dispersed networks. Because it is open source and self-hosted, your monitoring data stays entirely under your control — a decisive factor where data residency and self-management matter. And the active community plus optional paid support from Zabbix SIA mean you are not entirely on your own.
Where it falls short
Zabbix is not gentle with newcomers. The initial setup — server, database backend, frontend, agents — is more involved than a packaged commercial tool, and the concepts (items, triggers, templates, macros) take time to click. Expect a real learning investment before it feels productive.
The server component runs on Linux and leans on a database you must size and maintain; a busy Zabbix instance can put meaningful load on that database, so capacity planning is on you. The interface, while much improved over the years, is functional rather than beautiful, and building polished dashboards takes effort. In short, Zabbix trades ease for control. There is no vendor holding your hand unless you pay for support, and the “free” software still costs you time and expertise.
Who it’s for
Zabbix suits IT operations and network teams that have Linux comfort, in-house skills, and a reason to avoid licensing costs — often larger or cost-conscious organizations, or those with strict data-control requirements. It rewards teams willing to build templates properly and treat monitoring as an ongoing engineering discipline. If you are a small shop that wants a dashboard populated this afternoon with minimal fuss, a more turnkey option will make you happier.
Licensing and cost
Zabbix is open-source software under the GPLv2 license — free to install and use, with no tiered license fees for the platform itself. Zabbix SIA offers optional commercial extras such as technical support, training, and consulting for organizations that want vendor backing, but these are separate from the software and entirely optional. Because the core is free, there is nothing to budget for the platform beyond your own infrastructure and time; if you want paid support, check current offerings on the vendor’s official site.
How it compares
Among open-source monitors, Checkmk is the closest rival and often the friendlier one: its free Raw Edition brings strong auto-discovery and a gentler setup, with paid editions if you grow, whereas Zabbix gives you more raw flexibility at the cost of more manual template work. Nagios Core is older and more minimal — a plugin-driven engine you assemble yourself — where Zabbix is a more complete, integrated platform out of the box. On the commercial side, PRTG Network Monitor is the counterpoint: it installs fast and looks polished but charges a sensor-based subscription and wants a Windows server, while Zabbix asks for Linux skills and setup effort in exchange for costing nothing to license. Pick Zabbix when control and zero licensing win; pick the others when time-to-value or hand-holding matters more.
Getting it safely
Zabbix comes from the project’s own official site and its official package repositories. This is an independent catalog — we host nothing and distribute nothing. Get it from Zabbix’s official site (zabbix.com), where you will find source, packages, and installation documentation. Because it is open source you can inspect the code and deploy at your own pace, but you should still confirm you are pulling from genuine, official sources; see how to verify a download.
FAQ
Is Zabbix really free? Yes. The platform is open source under GPLv2 with no license fee. The only paid items are optional support, training, and consulting from Zabbix SIA, which you can take or leave.
What do I need to run it? A Linux host for the server, a supported database backend to store history and configuration, and the web frontend for access. You then roll out Zabbix agents or configure agentless checks (SNMP, IPMI, JMX, HTTP) on the systems you want to watch.
Is it hard to learn? Honestly, yes, relative to turnkey tools. Budget time to understand items, triggers, and templates. Once those concepts land, Zabbix scales well — but the early curve is steep, so plan for it rather than expecting instant results.
About the project
Zabbix is developed and maintained by Zabbix. This is an independent catalog — we don't host or distribute the software. For source code, documentation and official releases, see the project's own site.
same segment
Alternatives in Monitoring
All-in-one infrastructure monitoring with sensor-based subscription licensing, self-managed or cloud-hosted.
by PaesslerLong-standing open-source monitoring engine for hosts, services and network devices.
by Nagios EnterprisesNetwork and server monitoring with fault management and reporting.
by Zoho / ManageEngine